

convince a non-specialist audience
The semantic web, the power of linked data… If you are versed in the issues of access to information, knowledge generation, circulation, exchange, and sharing of information, all of this makes you dream a little.
A triplestore, rdf, sparql, ontologies, URIs… If you are not a computer scientist, all this at best does not evoke anything, at worst is repulsive.
When we opened the , these two contradictory visions appeared to us. We looked at what was being done elsewhere: how do other institutions open up their metadata, what uses are planned and promoted, how do we convince a non-computer scientist public of the interest of this “new” way of searching for information?
In most cases, triplestores are just that: warehouses of triples. The user has access to a Sparql endpoint and the site editor hopes (fingers crossed?) that he/she will know how to use it or will find a competent person to do it for him/her.
This solution did not seem satisfactory to us. Easy and quick to set up, yes, but not satisfactory. Our objective is that our metadata can be used by as many people as possible, that is to say, mainly by researchers in the Humanities and Social Sciences, since this is the main part of our content. This public is not a computer scientist. We quickly came to the conclusion that we needed to coat our triplestore with a generous layer of mediation. Of pedagogy. Of popularization.
Several questions needed to be addressed.
- Who are we addressing?
- What can our metadata be used for?
- How can we get this public to appropriate this tool?
Who do we talk to?

We know the public of Persee, a survey was conducted a few years ago, it described a large (more than 30 million consultation sessions per year) and faithful public (35% of users related to research or documentation professionals say they use it more than once a week and another 35% at least once a month). Two-thirds of the visitors (66%) are research-related (students, master’s students, doctoral students, teachers). And 72% use the portal for academic or professional purposes. Overall, Perseus is used by researchers, students and enthusiasts.
The more specific audience for metadata is more researcher, but not more computer scientist. Nevertheless, some of these researchers may seek the services of computer scientists and computer scientists may also want to access our data. We must therefore take into consideration both these audiences, novice and expert.
What can our metadata be used for?
Uses are a real issue. We sensed that this mountain of information (30 million triples!) was a precious resource for research, but we needed researchers’ approaches to identify these uses.
We therefore met with a number of researchers who were already working with metadata to find out what they were looking for and what they were finding.
Several generalizable standard uses emerged. The constitution of a corpus, the statistical exploitation of numerical data, the exploration of a career, a school, a network, the constitution of a bibliography.
How to make this tool useful, usable and acceptable
The best for last…
How to get searchers who are used to search engines to do Sparql queries?
First idea: we’ll make a Sparql tutorial. A bit of theory, a few videos, a few example queries, it’ll work!
Hmm. In fact there are already many Sparql tutorials, moocs and online courses. It’s long, it’s technical, it’s not accessible if you don’t master a certain number of computer notions.
Sparklis
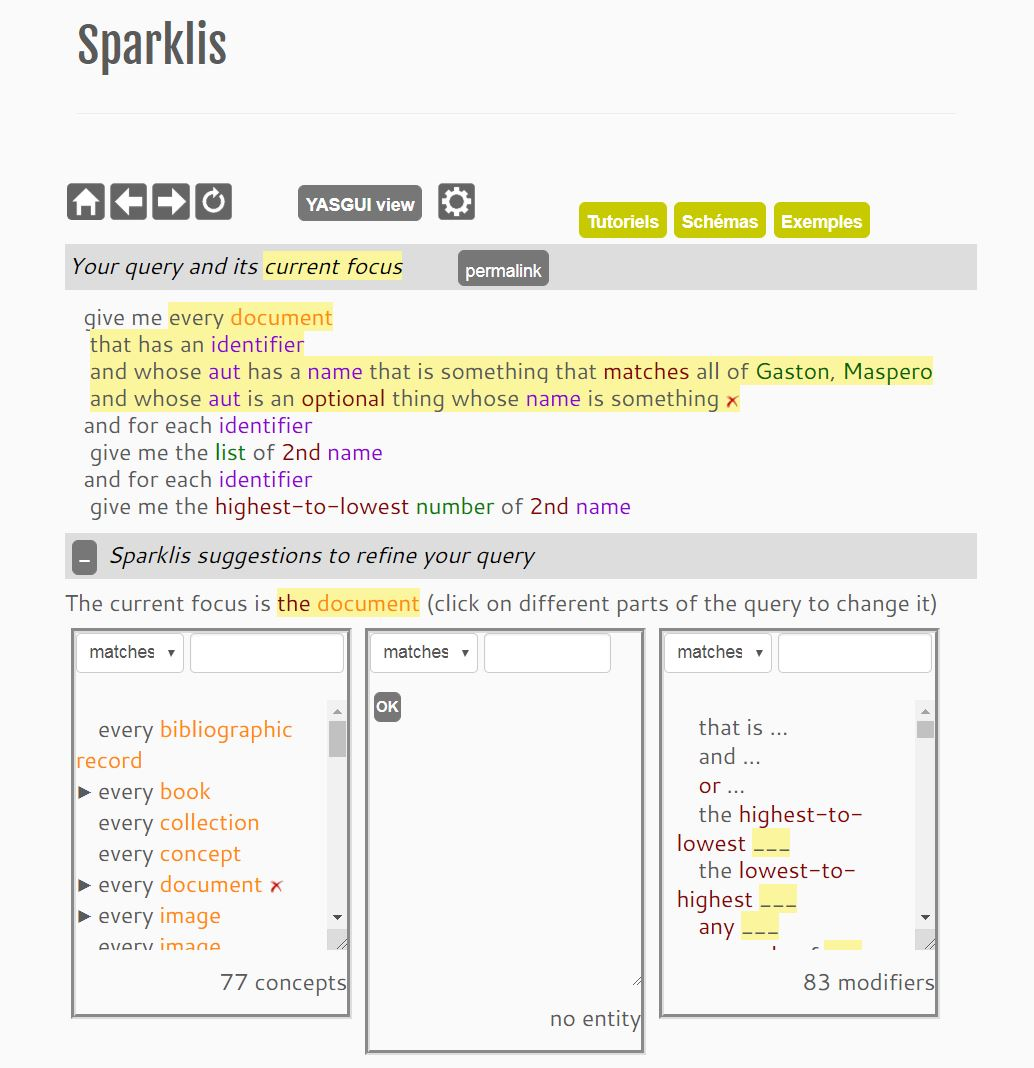
We were convinced that we should be able to find a way to query the graph through a “tree” system (which a graph is not, strictly speaking, we agree) or through drop-down menus. Fortunately, a kind soul mentioned the program of a teacher-researcher from Irisa, Sébastien Ferré, who proposes to generate Sparql queries via a graphical interface: Sparklis. This tool makes it possible to choose the type of entity and its properties from drop-down menus that adapt as the query is built. You can specify names, words, dates and then sort and group the query results. Sparklis is a complete solution in which the user can visualize the Sparql query that the program has generated, download the results as a spreadsheet and directly access the Google graph menus to create curves, histograms or other graphs from his data.
Sébastien Ferré was immediately very responsive and enthusiastic about letting us deploy his solution on our site, thank you to him!
A ladle of explanations, a spoonful of video, a pinch of tutorials

So we wrote theoretical and technical content, recorded tutorial videos and designed reusable example queries, all on Sparklis.
We added some explanations about the web of data, the history of our triplestore and how it was “made”, graphical representations of our data schemas, some visualization tools and a space for exchanges between users and between them and us, to help them in case of need.
It remained to organize all these contents, that was done during an ideation workshop. We decided to divide our pages into three menus: Explore, Understand and Share, always keeping the direct links to the graph exploration pages: Sparklis and Sparql endpoint.
Cécile Almonté, master Architecture de l’informatique – ENS de Lyon